Goal: Interrelate representations of kinematical quantities
Source: CT151.2-8

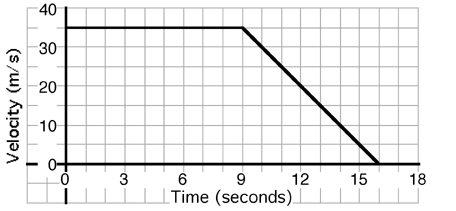
An object’s motion is described by the graph above. The position of the
object at t = 9 seconds is most nearly…
- 0 meters
- 200 meters
- 300 meters
- 400 meters
- 500 meters
- Cannot be determined
Commentary:
Answer
(6) This problem is primarily to determine if students appreciate the
information available from a graph. Many students will determine the
displacement forgetting that the initial position is unknown.