Tag Archives: Displacement

A2L Item 079

Goal: Distinguish average velocity from velocity.

Source: UMPERG

A car is initially located at the 109 mile marker on a long straight
highway. Two and one half minutes later the car is located at the 111
mile marker.

What is the velocity of the car?

  1. 24 mph
  2. 32 mph
  3. 40 mph
  4. 48 mph
  5. 55 mph
  6. 64 mph
  7. Cannot be determined

Commentary:

Answer

The correct answer is (7) because only the average velocity can be
determined. However, students who respond (4) should not be
disconfirmed but prodded to be more discriminating when interpreting
questions. They have assumed that the car is traveling with a uniform
speed.

Background

Students should be able to extract kinematical quantities from everyday
situations. They should also have a sense of the size of these
quantities.

Questions to Reveal Student Reasoning

What is the speed of the car when it is at the 109 mile marker? How do
you know?

Is it possible for the car to be at rest initially and reach the 111
mile marker two and one half minutes later? If it had constant
acceleration, what would its speed be when it reached the 111 mile
marker?

Suggestions

Have students make a sketch of position vs. time. They probably assume
that the speed is uniform throughout the time interval. Have them
consider other paths that still connect the two known points on the
position vs. time plot. Draw some reasonable path and have the students
describe what the car is doing during that interval.

A2L Item 071

Goal: Recognize forces that do work, that is those with associated displacement.

Source: UMPERG-ctqpe52

A block having mass m moves along an incline having friction as shown in
the diagram above. The spring is extended from its relaxed length. As
the block moves a small distance up the incline, how many forces do work
on the block?

  1. One force
  2. Two forces
  3. Three forces
  4. Four forces
  5. Five forces
  6. Six forces
  7. Seven forces
  8. None of the above
  9. Cannot be determined

Commentary:

Answer

(4) Four forces do work on the block: gravitation, rope, spring, kinetic
friction (because you are told the block moves). The normal force does
no work.

Background

Recognizing those forces that do work is an important skill for students
to master. They also need to recognize whether the work is positive or
negative.

Questions to Reveal Student Reasoning

As the block moves up the plane, which forces do positive work? negative
work? How are you determining which it is? How would your answer to the
above question change if the spring were compressed rather than
extended.

Suggestions

Set up some situations with blocks, springs and ropes and let students
practice identifying all the forces doing work. This is a good activity
to do in conjunction with drawing free body diagrams.

A2L Item 009

Goal: Relate friction, velocity, and time.

Source: UMPERG

A cart rolls across a table two meters in length. Half of the length of
the table is covered with felt which slows the cart at a constant rate.
Where should the felt be placed so that the cart crosses the table in
the least amount of time?

  1. On the first half of the table
  2. Centered on the table
  3. On the second half of the table
  4. It doesn’t matter where the felt is placed
  5. None of the above
  6. Cannot be determined

Commentary:

Answer

The
felt should be placed on the second half of the table. After the cart
rolls across the felt it will travel at a lower speed. To minimize the
time to cross the table one must minimize the time the cart spends at
the lower speed. The graph to the right illustrates the point for the
two extreme cases: felt on first half (gray curve) and felt on second
half (black curve). The velocity vs. time graph for the case where the
felt is on the second half of the table is above the velocity vs. time
graph for all other possibilities. Answer (3) is the best choice.

Background

Students should have some experience using the concepts of velocity and
acceleration to solve kinematics problems and analyze graphs. The
question students need to answer is what configuration will permit the
cart to travel at a higher speed for the longest period of time (or the
lowest speed for the shortest period of time). A graph provides support
for a conceptual argument.

Issues to consider: (1) Can students reason and analyze a situation
involving constant acceleration. (2) Do students try to solve the
problem using algebraic methods? (2) Can students use graphical methods
and conceptual reasoning? (3) Can students verbalize the central idea —
an object will travel a certain distance in less time if its speed is
higher?

Questions to Reveal Student Thinking

Where is the cart moving the fastest? … the slowest?

What does a graph of the velocity vs. time look like?

How do you determine when the cart has reached the end of the table from
a graph of velocity vs. time?

Suggestions

Try some limiting cases. If the piece of felt were small (say 10 cm)
but slowed the cart from 1 to .8 m/s on a 3m table. Approximately how
long would the trip take if the felt were placed at the beginning of the
table?…at the end of the table?

A2L Item 007

Goal: Linking acceleration to changes in velocity.

Source: UMPERG

A marble rolls onto a piece of felt that is 30 cm in length. At 20 cm
the speed of the marble is half of its initial value. Which of the
following is true? Assume that the acceleration is constant on the felt.

  1. The marble will come to rest on the felt.
  2. The marble will go past the end of the felt.
  3. What will happen cannot be determined.

Commentary:

Answer

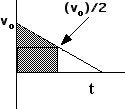
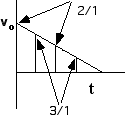
(1) The marble will come to rest on the felt. A graph of velocity vs. time is helpful for analyzing this problem. The distance traveled while slowing down to half its initial speed (i.e., the first 20 cm) is three times the additional distance (i.e., the distance beyond 20 cm) the marble will roll before coming to rest. This can be seen by comparing the areas for
these two different time periods. The marble will come to rest at approximately 26.7 cm.

Background

Students should have some experience using the concept of acceleration to solve kinematics problems and analyze graphs. The answer is less important than how students represent the problem and how they approach solving the problem.

Issues to consider:
(1) Do students only solve the problem using algebraic methods? (2) To what extent do students use other approaches? (3) Do students use graphical methods involving areas? (4) Do theycompare average speeds for the two periods (i.e., the period covering the first 20 cm and the remaining period of time before the marble comes to rest)? (5) Do they compare the actual speeds of the marble at each instant of time for the two time periods (the ratio is usually greater than or equal to 2/1 at each corresponding time, as shown in the accompanying graph). (6) Even if the students use algebraic methods, do they employ a strategy or do they do so mindlessly?

Questions to Reveal Student Thinking

Ask students to consider the following context (which they are familiar with and is algebraically simple): an object is dropped from rest. How fast is it moving after one second? … after two seconds? …after three seconds? How far has it traveled after one second? …after two seconds?…after three seconds? What is the relationship between velocity and position? Why is the relationship not linear?

Suggestions

If students do not use a graph to solve the problem, ask them to draw a velocity vs. time graph for the situation and then use the graph to solve the problem.

A demonstration is possible.